Hacking a Waterfall Chart in PowerBI
- Pi Eye
- Feb 21, 2023
- 2 min read

Updated: Mar 20, 2023

PowerBI comes with a waterfall chart as a default visual which is very convenient to create. However it is not very flexible, as attested by some posts in the community https://community.powerbi.com/t5/DAX-Commands-and-Tips/quot-Hacking-quot-a-waterfall-chart/m-p/3084765/thread-id/107731
So how to create a fully customisable waterfall chart? Here, I am going to create several expressions that calculate the height of the "white space" (how high each block is) and then different ones for each coloured block. This means that I can adjust the colours depending on what I would like them to represent and we are not just limited to the "up/down/start/end" as offered by the default visual
Thanks to the new waterfall functions offered by Microsoft in DAX, it is now much easier to create the expressions such as cumulative totals which I need.
Calculations needed
The examples below work using a dataset based on a [Date] field (for the grouping) and [Sum of Amount] which is the measure field
Cumulative total & cumulative total from the previous step
This is so we can work out the invisible white space, which is the smaller amount of the two
Waterfall Cumulative = calculate([Sum of Amount],
    WINDOW(1,ABS,0,REL,
    SUMMARIZE(ALLSELECTED(Sheet1),Sheet1[Date]),
    ORDERBY(Sheet1[Date])
    ))
Waterfall Cumulative -1 = calculate([Sum of Amount],
    WINDOW(1,ABS,-1,REL,
    SUMMARIZE(ALLSELECTED(Sheet1),Sheet1[Date]),
    ORDERBY(Sheet1[Date])
    ))
Waterfall White Space = min([Waterfall Cumulative -1],[Waterfall Cumulative])
Waterfall Blocks - positive, negative, and "special" colour
The coloured blocks that sit on top of the white space and appear to float.
The logic here is simply to separate out the blocks so I can assign different colours to them. If you do not need a different colour you can just set this as "Abs(<value>)"
Waterfall Block -ve = If(AND([Sum of Amount]<0,DATEDIFF(DATE(2023,5,6), Max(Sheet1[Date]) ,DAY)<>0),Abs([Sum of Amount]))
Waterfall Block +ve = if([Sum of Amount]>0 ,[Sum of Amount])
Waterfall Block Special = If(DATEDIFF(DATE(2023,5,6), Max(Sheet1[Date]) ,DAY)=0,Abs([Sum of Amount]))
Result
Add the 3 blocks and whitespace to your stacked chart, and edit the colours making sure that the whitespace is white (of course)

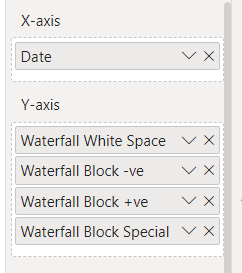


And you now have a waterfall chart with some more customisation than is offered as default:

Comments